Test a Perceptual Phenomenon
- By Quentin Ikeno
- Sun 18 February 2018
Background
In a Stroop task, participants are presented with a list of words, with each word displayed in a color of ink. The participant's task is to say out loud the color of the ink in which the word is printed. The task has two conditions: a congruent words condition, and an incongruent words condition. In the congruent words condition, the words being displayed are color words whose names match the colors in which they are printed. In the incongruent words condition, the words displayed are color words whose names do not match the colors in which they are printed. In each case, we measure the time it takes to name the ink colors in equally-sized lists. Each participant will go through and record a time from each condition.
##
## Attaching package: 'gridExtra'
## The following object is masked from 'package:dplyr':
##
##     combine
What is our independent variable? What is our dependent variable?
The independent variable in this dataset is the type of condition (i.e. the congruent words condition and the incongruent words condition). The dependent variable is the time taken for participants to go through the list for each condition.
What is an appropriate set of hypotheses for this task? What kind of statistical test do you expect to perform? Justify your choices.
The set of hypotheses for this test will be:
\(H_{0}\): \(\mu_{I}\) - \(\mu_{C}\) \(=\) 0
(There is no significant difference between the population mean completion time for the incongruent words condition (\(\mu_{I}\)) and the population mean completion time for the congruent words condition (\(\mu_{C}\))).
\(H_{A}\): \(\mu_{I}\) - \(\mu_{C}\) \(>\) 0
(The difference between the population mean completion time for the incongruent words condition and the population mean completion time for the congruent words condition is greater than zero).
I decided the appropriate statistical test to perform will be the paired sample t-test since:
-
We are working with dependent samples since we are comparing two sets of times for tests taken by the same subject.
-
We do not know population standard deviations.
-
Our sample size is less than 30
That said, one crucial assumption we need to make in order for us to use the paired t-test is that the data we sample from comes from a normal distribution. We will check this assumption later in the report by visaulizing our sample data.
Report some descriptive statistics regarding this dataset. Include at least one measure of central tendency and at least one measure of variability.
##    Min. 1st Qu.  Median    Mean 3rd Qu.    Max.
##    8.63   11.90   14.36   14.05   16.20   22.33
## [1] 3.559358
Here are some descriptive statistics for the congruent condition data. We can see that the mean time is 14.05 with a standard deviation of 3.559. That said, what will the incongruent condition data look like?
##    Min. 1st Qu.  Median    Mean 3rd Qu.    Max.
##   15.69   18.72   21.02   22.02   24.05   35.26
## [1] 4.797057
The mean time is 22.02 while the standard deviation is 4.797. Let's get another look at the distribution of the data with visualizations.
Provide one or two visualizations that show the distribution of the sample data. Write one or two sentences noting what you observe about the plot or plots.
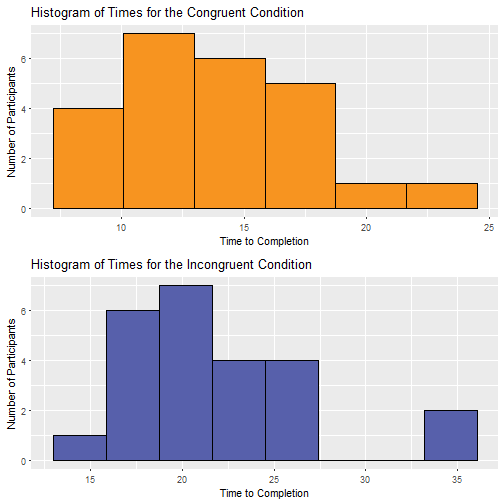
Looking at the histogram for the congruent condition data, it appears as though the data is most likely normally distributed. On the other hand, the histogram for the incongruent condition data appears as though it may have some outlier participants which may affect the normality of the data.
##
##  Anderson-Darling normality test
##
## data:  stroop$Congruent
## A = 0.20967, p-value = 0.8432
##
##  Anderson-Darling normality test
##
## data:  stroop$Incongruent
## A = 1.0696, p-value = 0.006709
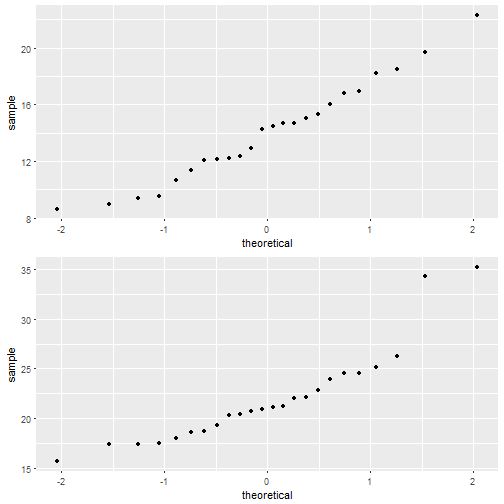
If we look at normal probability plot for the congruent data, the points appears to fall a relatively straight line and is thus most likely normally distributed. If we perform an Anderson-Darling test of normality on the data, where \(\alpha\) = 0.05, we can see that the p-value for the test is 0.8432. Since the p-value is above 0.05, there is not enough evidence to conclude that the data is not normally distributed.
However, If we look at the probability plot for the incongruent data, two points on the right do not fall on the with the rest of the data, which suggests the data may not be normally distributed. Performing an Anderson-Darling test, with \(\alpha\) = 0.05, the p-value is 0.0067, which is less than 0.05, therefore there is evidence that this data is not normally distributed. This poses a problem for our paired t-test, since a requirement of performing the test is that the data we use is normally distributed or if it is not normally distributed, we are using a very large sample. Since we cannot fulfill this requirement, typically this means that we cannot perform the t-test and should perform some other kind of test. That being said, for the sake of completing this project I will go ahead and perform the paired t-test.
Now, perform the statistical test and report your results. What is your confidence level and your critical statistic value? Do you reject the null hypothesis or fail to reject it? Come to a conclusion in terms of the experiment task. Did the results match up with your expectations?
The confidence level I decided to use an \(\alpha\) = 0.05 meaning our confidence level will be 0.95. The test statistic I came up with is 8.0207. Using a t-table, the critical statistic value, with 23 degrees of freedom, is 1.7139. So, since the test statistic (8.0207) is greater than the critical value (1.7139) we should reject the null hypothesis. We can conclude that there is evidence that the difference between the population mean completion time for the incongruent condition and the congruent condition is greater than 0.
Conclusion
From these results it appears as though participants in the Stroop task take significantly longer when it comes to completing the list of incongruent words. These findings happened to match up with my expectations, as I personally took longer to complete the incongruent condition when performing the Stroop task.
References
https://www.r-bloggers.com/normality-tests-for-continuous-data/
http://ggplot2.tidyverse.org/reference/geom_qq.html
http://www.statisticshowto.com/when-to-use-a-t-score-vs-z-score/